Document Metadata
Format: PDF 1.7
Title: Collect Trace Data from a CUCM Cluster
Producer: iText® Core 7.2.5 (AGPL version), pdfHTML 4.0.5 (AGPL version) ©2000-2023 iText Group NV
Creation Date: D:20240826090125-07'00'
Mod Date: D:20240826093008-07'00'
Page 1
Collect Trace Data from a CUCM Cluster
Contents
Introduction
Prerequisites
Requirements
Components Used
Background Information
Install the RTMT Application
Configure or Confirm Detailed Tracing for the CallManager Service
Configure or Confirm Detailed Tracing for the CTI Manager Service
Reproduce the Issue and Take Notes
Gather the Requested Traces
Verify Trace File Coverage
Attach a Trace Package to Your Service Request
Analysis
Introduction
This document describes how to use the trace collection process of the Cisco Unified Communications
Manager (CUCM/CallManager).
Prerequisites
Requirements
Cisco recommends that you have knowledge of these topics:
Real-Time Monitoring Tool (RTMT) application
•
Detailed tracing for the CallManager service
•
Detailed tracing for the computer-telephony integration (CTI) Manager service
•
Note: You must be a registered Cisco client to use these tools.
Components Used
The information in this document is based on CUCM 11.X and later versions.
The information in this document was created from the devices in a specific lab environment. All of the
devices used in this document started with a cleared (default) configuration. If your network is live, ensure
that you understand the potential impact of any command.
Background Information
Page 2
If you work with a Technical Assistance Engineer (TAC) engineer on a Communications Manager issue,
you need to collect CUCM traces. This could be a task you do infrequently or have never done before.
In this scenario, you troubleshoot a call that has not been recorded even though the CUCM-side
configuration appears to be correct. The administrator receives an alarm message for each call that failed to
record, so the TAC engineer has asked you to reproduce the issue and gather detailed CallManager traces,
detailed CTI Manager traces, and Event Viewer logs from the CUCM side. These logs capture the call
signaling events, the CTI messages that are exchanged with the server that records the calls, and the alarms
from the call that failed to be recorded.
To complete this task:
Install the RTMT application
•
Configure or confirm detailed traces for the CallManager service
•
Configure or confirm detailed traces for the CTI Manager service
•
Reproduce the issue and take notes
•
Gather the requested traces
•
Verify trace file coverage
•
Attach a trace package to your service request
•
Install the RTMT Application
In CUCM, the RTMT application is used to gather traces for most types of issues. Every major and minor
version of CUCM has an associated version of the RTMT application. If, on your PC, you do not see a
Unified RTMT program group under Start > Programs > Cisco, or if the RTMT version does not match
your CUCM cluster, you must install the RTMT tool for your CUCM version before you move forward.
Log in to the Cisco Unified CM Administration Page.
1.
Choose Application > Plugins.
2.
Click Find.
3.
Click the Download link for the Cisco Unified Real-Time Monitoring Tool – Windows plugin.
4.
Save the CcmServRtmtPlugin.exe file.
5.
Run CcmServRtmtPlugin.exe.
6.
Step through the directions of the InstallAnywhere installation wizard, accept the License Agreement
and install to the default folder location. If you had an old version of RTMT installed, the installation
wizard directs you to uninstall the old version before you proceed.
7.
Choose Start > Programs > Cisco > Unified RTMT and launch Cisco Unified Real-Time
Monitoring Tool.
8.
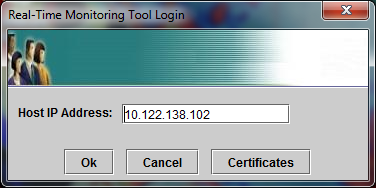
In the Real-Time Monitoring Tool Login window, enter the IP address for your CUCM Publisher.
9.
Page 3
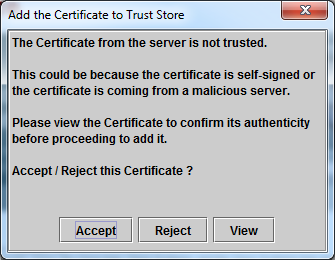
In the Add the Certificate to Trust Store window, click Accept.
10.
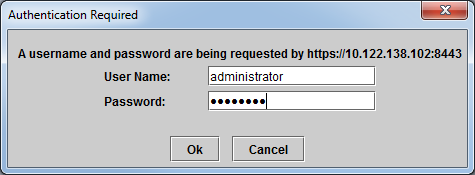
In the Authentication Required window, enter the same User Name and Password as you do to log on
to the CUCM Administration page.
11.
Page 4
If you are unable to log on, add theRealtime and TraceCollection permissions to your user account, or
use the application administrator account created when the system was installed and try again.
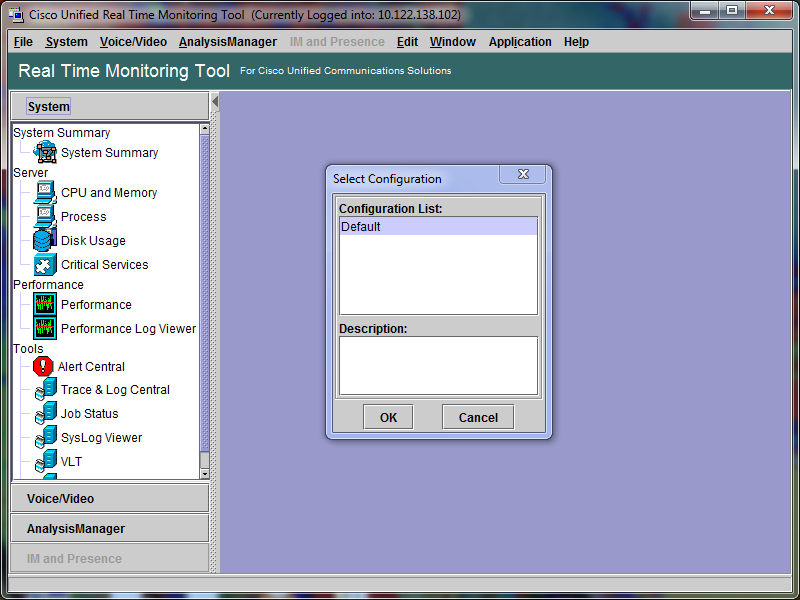
The application opens, and you can see a Select Configuration window. Click OK in order to select
the Default configuration.
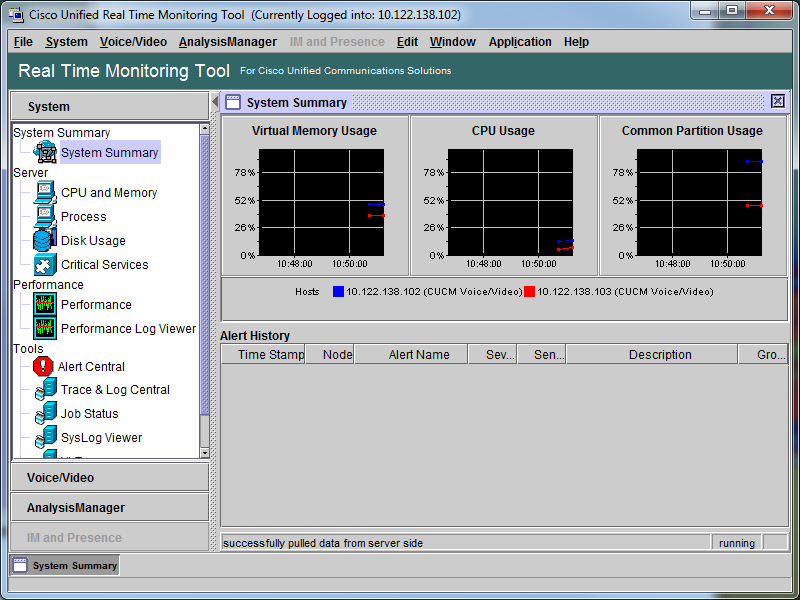
The System Summary page opens.
12.
Page 5
You have now verified that RTMT is installed, and that you are able to log on to your CUCM cluster with
the tool.
Configure or Confirm Detailed Tracing for the CallManager
Service
In CUCM 9.X and later, detailed tracing is enabled by default for the CallManager service. Before you
proceed, confirm that detailed tracing is still configured. If not, configure it.
Log on to the Cisco Unified Serviceability page.
1.
Choose Trace > Configuration.
2.
From the Server drop-down list, choose the CUCM Publisher and click Go.
3.
From the Service Group drop-down list, choose CM Services and click Go.
4.
From the Service drop-down list, choose Cisco CallManager and click Go.
5.
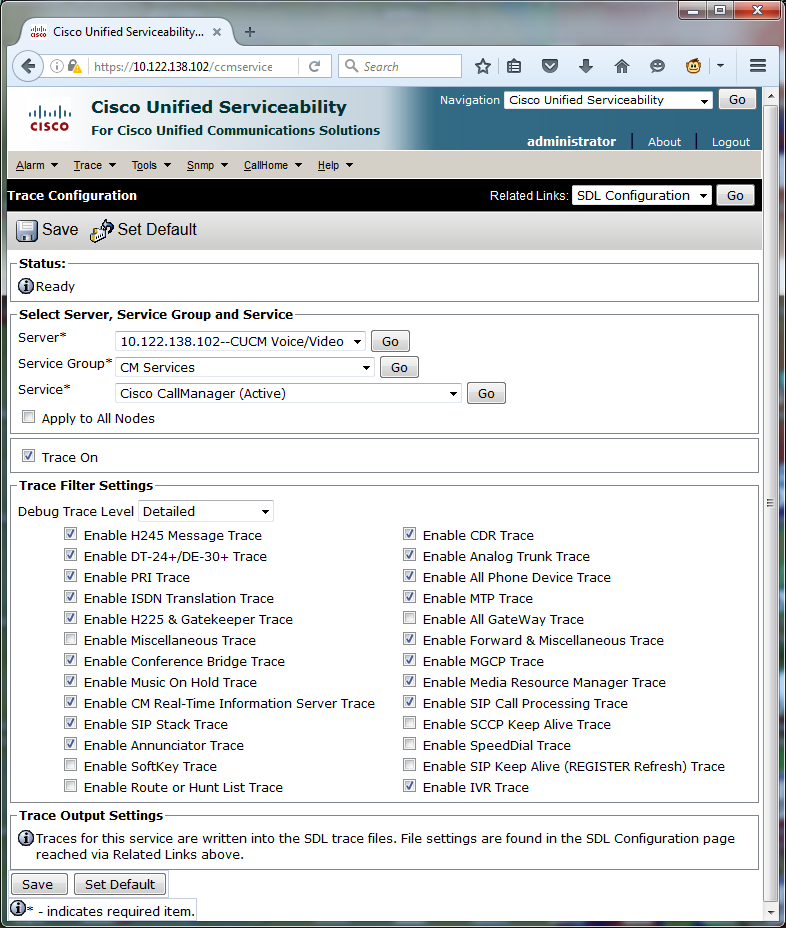
The system is configured for the default detailed tracing, as shown in this image:
6.
Page 6
Trace On is enabled.
•
The Debug Trace Level is set to Detailed.
•
All Trace Filters are enabled, with the exception of:
Enable Miscellaneous Trace
○
Enable SoftKey Trace
○
Enable Route or Hunt List Trace
○
Enable All GateWay Trace
○
Enable SCCP Keep Alive Trace
○
Enable SpeedDial Trace
○
Enable SIP Keep Alive (REGISTER Refresh) Trace
○
•
Page 7
If the system is not configured with at least the default detailed tracing settings, and if you use CUCM
9.x or later:
Click Set Default. This reverts trace configuration for this service to default settings.
a.
Choose Apply to All Nodes.
b.
Click Save.
c.
7.
Confirm trace configuration on the other servers in the cluster.
8.
If you use an earlier version of CUCM, you need to manually configure your trace settings to match the
illustration. The Set Default button on earlier versions sets the Debug Trace Level to Error, and not the
Detailed.
Configure or Confirm Detailed Tracing for the CTI Manager
Service
In CUCM 9.X and later, detailed tracing is also enabled by default for the CTI Manager service. Before you
proceed, confirm or configure this capability.
Log in to the Cisco Unified Serviceability page.
1.
Choose Trace > Configuration.
2.
From the Server drop-down list, choose the CUCM Publisher and click Go.
3.
From the Service Group drop-down list, choose CM Services and click Go.
4.
From the Service drop-down list, choose Cisco CallManager and click Go.
5.
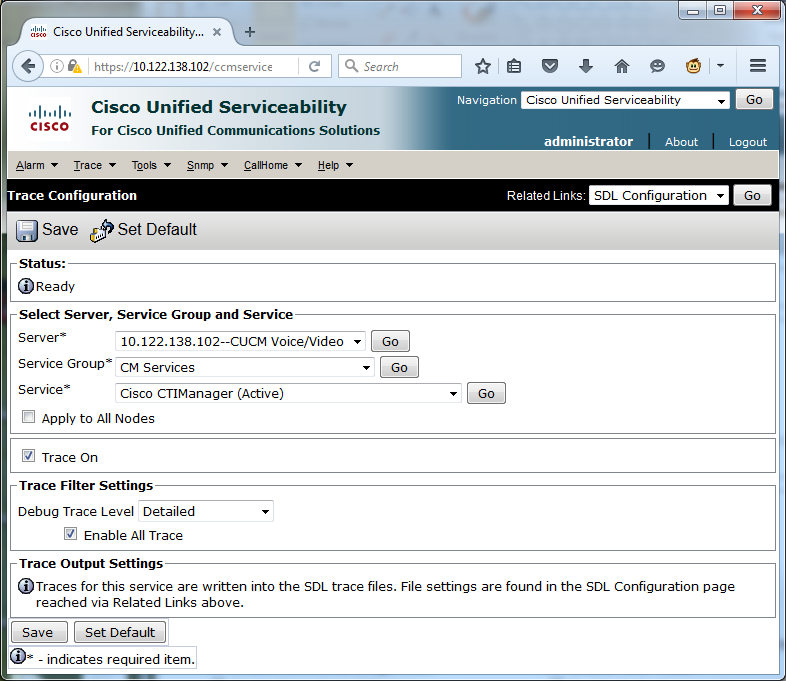
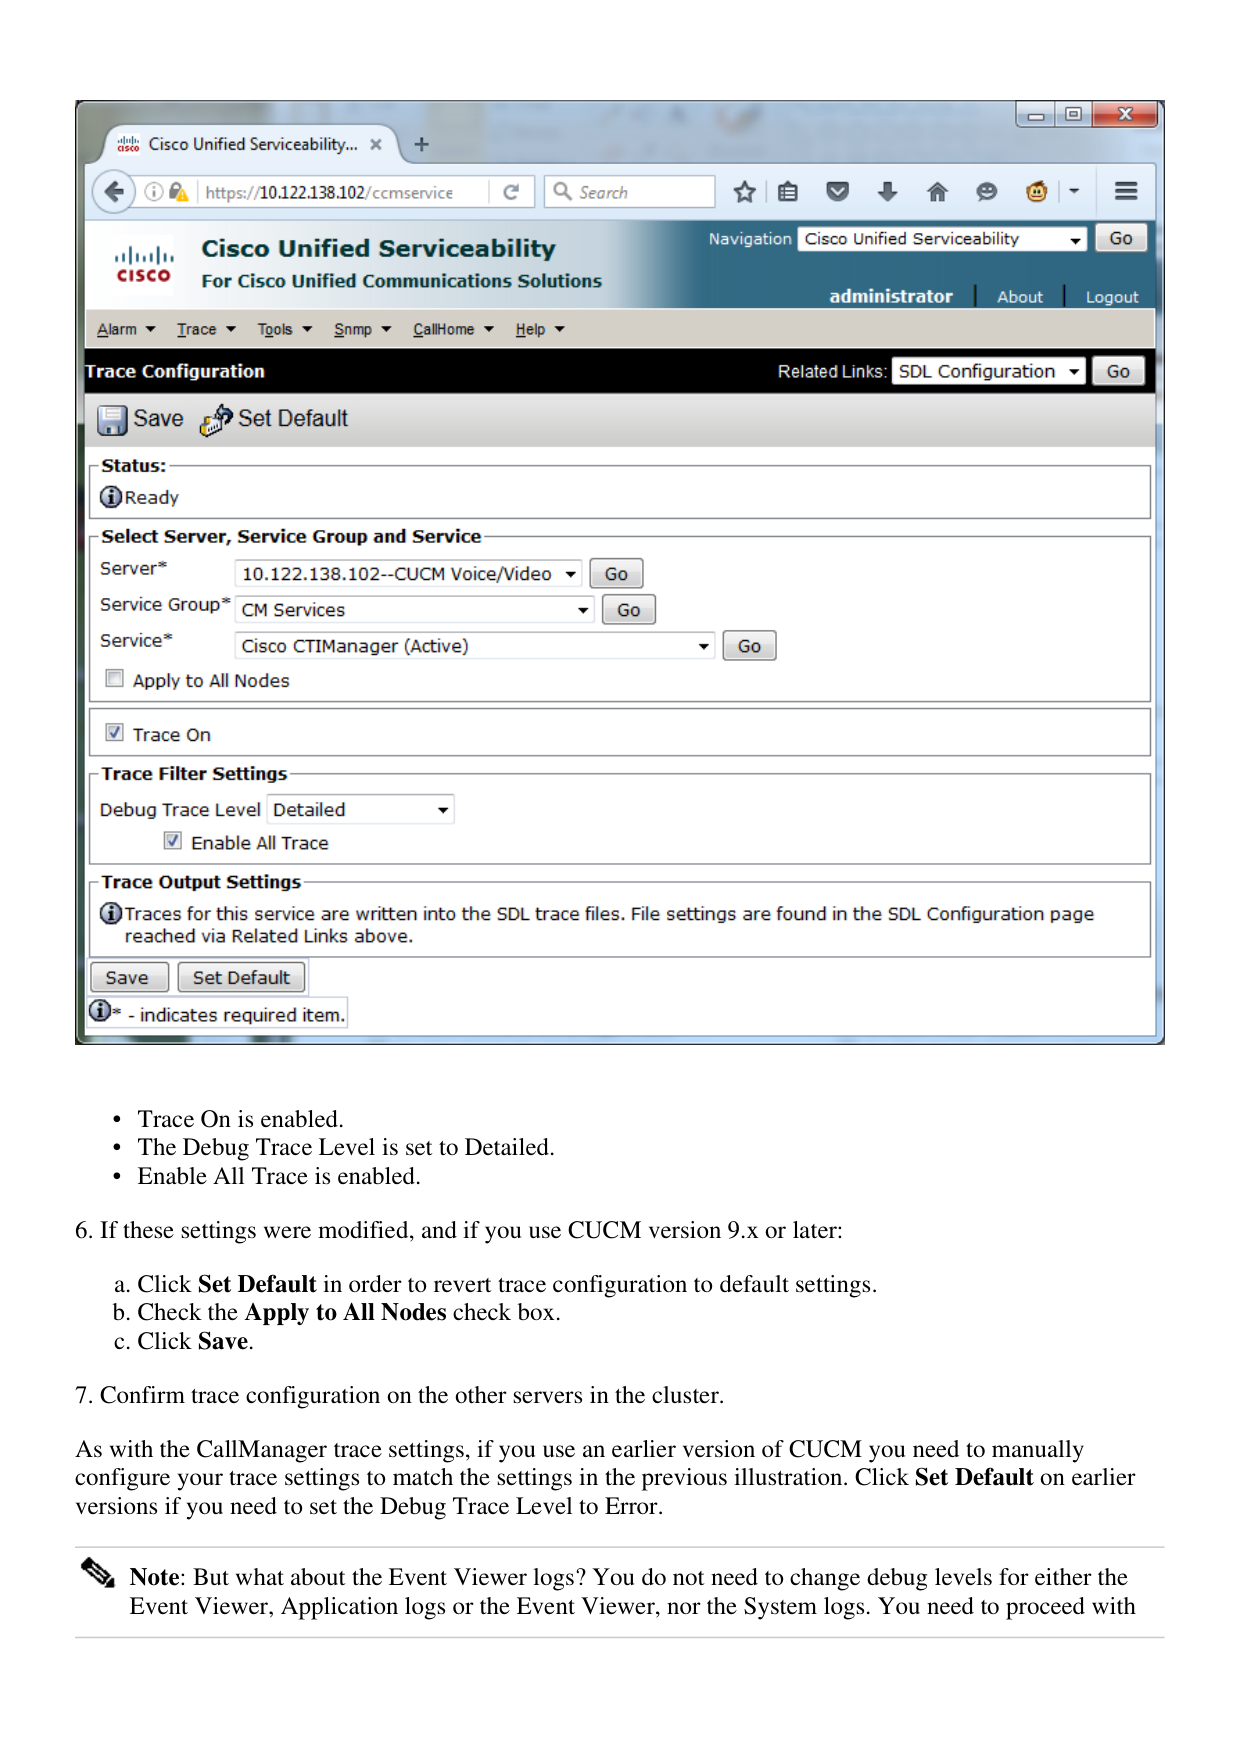
The system is configured for the default detailed tracing, as shown in this image:
Page 8
Trace On is enabled.
•
The Debug Trace Level is set to Detailed.
•
Enable All Trace is enabled.
•
6. If these settings were modified, and if you use CUCM version 9.x or later:
Click Set Default in order to revert trace configuration to default settings.
a.
Check the Apply to All Nodes check box.
b.
Click Save.
c.
7. Confirm trace configuration on the other servers in the cluster.
As with the CallManager trace settings, if you use an earlier version of CUCM you need to manually
configure your trace settings to match the settings in the previous illustration. Click Set Default on earlier
versions if you need to set the Debug Trace Level to Error.
Note: But what about the Event Viewer logs? You do not need to change debug levels for either the
Event Viewer, Application logs or the Event Viewer, nor the System logs. You need to proceed with
Page 9
issue reproduction.
Reproduce the Issue and Take Notes
In this scenario, you can place test calls to generate a failure. It helps the TAC Engineer to analyze the call if
you provide information on the set of traces that have no information about the test calls. Also, you risk the
collection of data for the wrong time frame and if that happens, you have to start over.
For each test call, record this information:
The phone number for the party that called.
•
The called party phone number.
•
The call start time.
•
The call end time.
•
Time and description for any issues you experienced during the call
•
As CUCM traces can be very lengthy, TAC needs those call details in order to find your test calls in the
data.
Gather the Requested Traces
After the issue was reproduced, gather the traces requested by TAC immediately. If you do, the files are not
overwritten before you can gather them.
In this scenario, you need to collect CallManager traces, CTI Manager traces, and all Event Viewer logs.
Unless TAC has given you other instructions, you need to collect those files from all servers for the
complete time range that covers your test call or calls. This prevents the lost of traces from a server that you
did not know was in the call flow.
Launch the RTMT.
1.
Connect to the IP address of your CUCM Publisher.
2.
Log on with the same credentials you use for the CUCM Administration web page.
3.
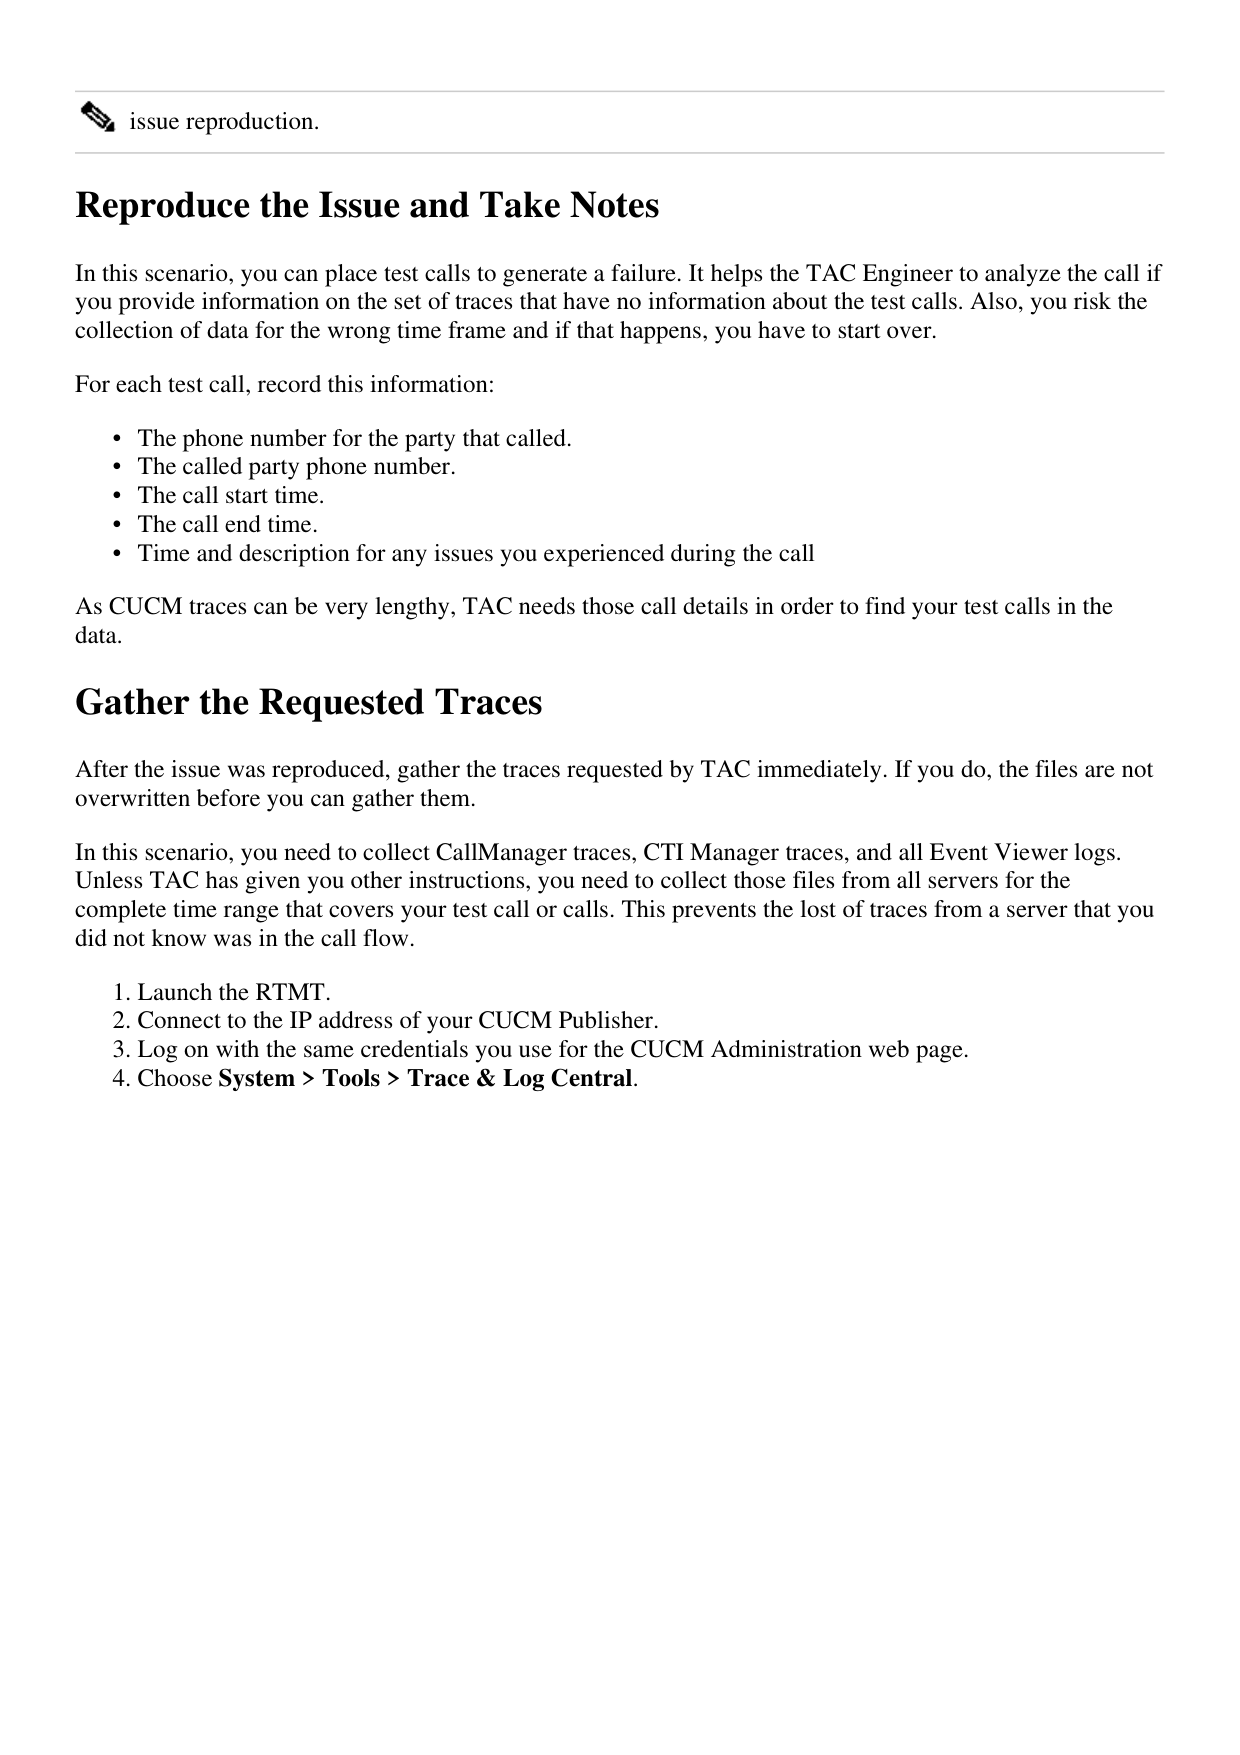
Choose System > Tools > Trace & Log Central.
4.
Page 10
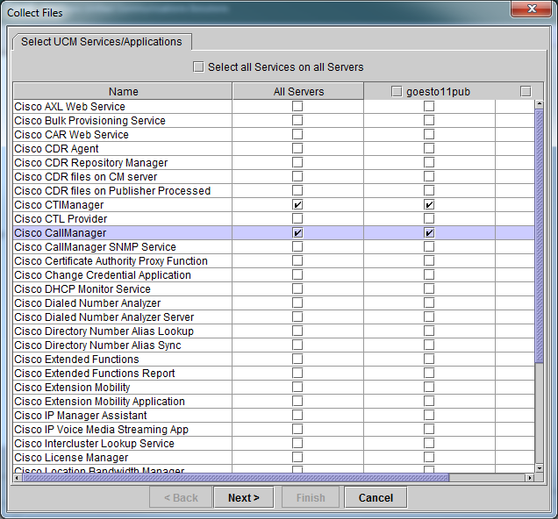
Double-click Collect Files. The Collect Files window opens to Select UCM Services/Applications.
5.
In Select UCM Services/Applications, click the check box in the All Servers column for:
Cisco CTIManager
•
Cisco CallManager
•
6.
Page 11
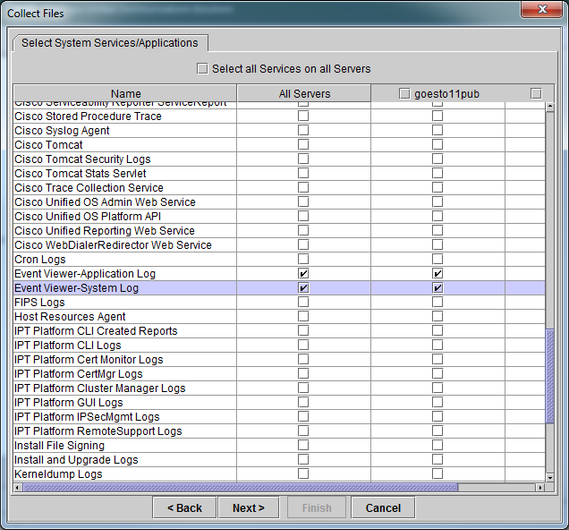
Click Next. The Collect Files window advances to Select System Services/Applications.
7.
In Select System Services/Applications, click the check box in the All Servers column for:
Event Viewer-Application Log
•
Event Viewer-System Log
•
8.
Page 12
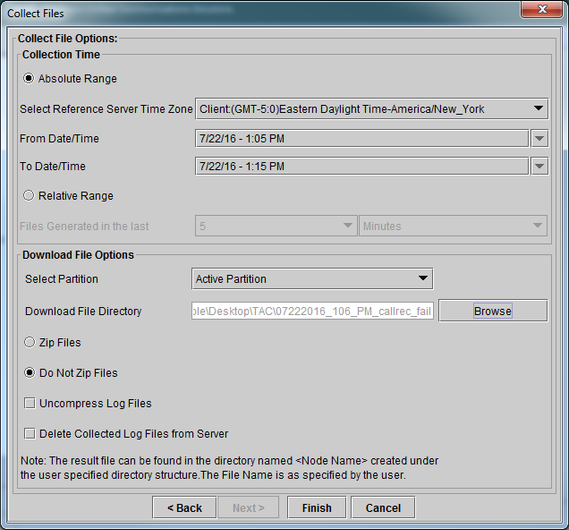
Click Next. The Collect Files window advances to the Collect File Options screen.
9.
Configure your Collection Time:
As you have timestamps for your test call(s), click the Absolute Range radio button.
a.
From the From Date/Time drop-down list, choose the time for one minute before your first test
call.
b.
From the To Date/Time drop-down list, choose the time for one minute after your last test call.
c.
10.
Configure your Download File Options.
Click Browse in order to configure your Download File Directory and specify a new directory
for each trace file collection. For example, when you want to download these files to
Desktop\TAC\callrectest01. Traces for a later test could go to Desktop\TAC\callrectest02. This
keeps the collected file sets for each issue reproduction organized and separated.
a.
Leave all other settings set to the defaults.
b.
11.
Page 13
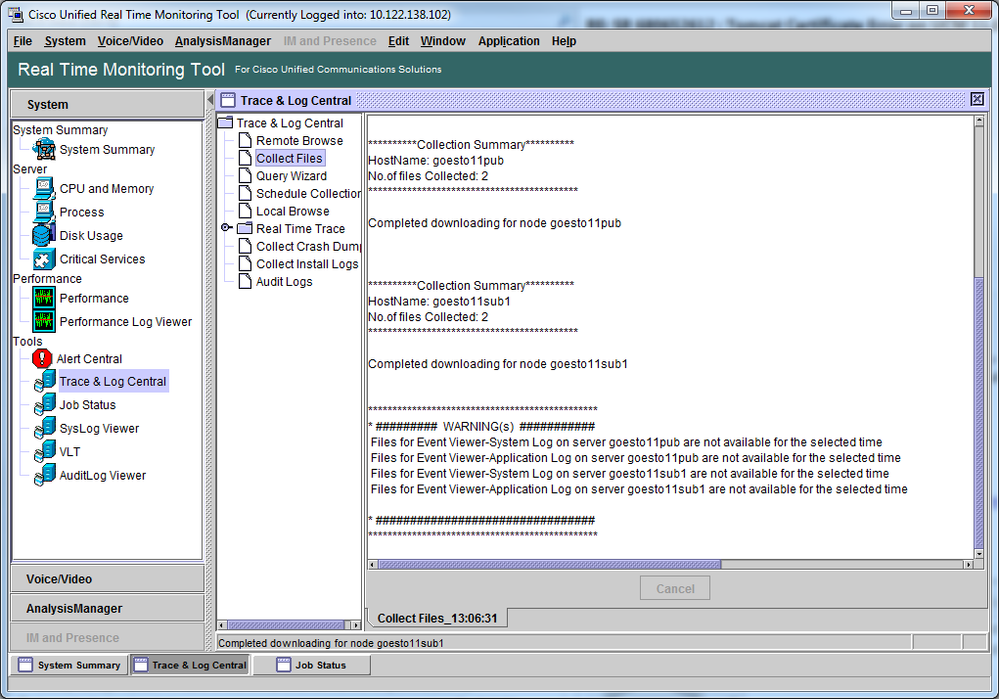
Click Finish.
12.
The Collect Files window updates with the status of trace collection. While trace collection continues, you
can see a Cancel button is available. When collection is complete, the Cancel button is grayed out.
Page 14
Verify Trace File Coverage
Review the files that you have gathered in order to ensure they cover the problem time frame. The simplest
way to do this is to review the TraceCollectionResult*.xml files.
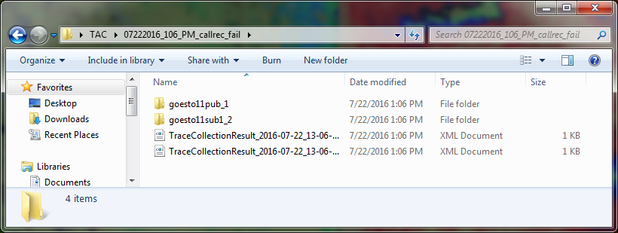
When RTMT collects a set of files, it writes a TraceCollectionResult*.xml file to the download file
directory for each server that it collects data from. You can see these files along with subdirectories for each
CUCM server. The TraceCollectionResult*.xml files state which files were successfully downloaded from
each server. The subdirectories contain the actual trace and log files.
Page 15
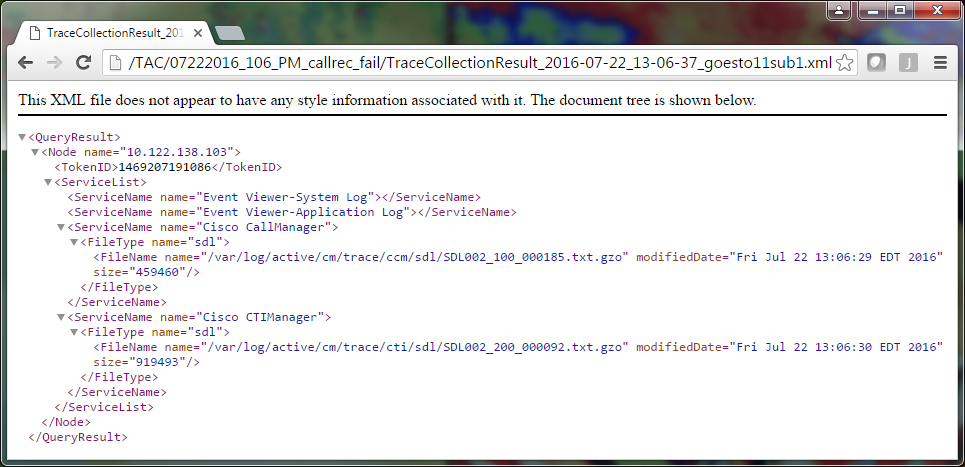
Open each TraceCollectionResult file and observe whether the modified date for the listed file or files maps
to the date and time range for your trace collection. If trace files could not be collected, for example, they
are overwritten, then they are lost.
If you are familiar with earlier versions of CUCM, this version differs in that the Cisco CallManager traces
are a single set of SDL* traces, not a set of SDL* traces and a set of ccm* traces. This is because, in CUCM
9.X and later, traces are interwoven into a single set of files which makes analysis easier. The same is true
for the Cisco CTI Manager service. Instead of both the SDL* traces and cti* traces, all of the data is in the
SDL* traces for that service.
Trace collection issues can usually be avoided if you collect traces immediately after an issue reproduction.
Note: The TraceCollectionResult*.xml files simply contain a list of files which were successfully
collected from each CUCM server. TAC needs to review the actual trace and log files that were
collected.
Attach a Trace Package to Your Service Request
Now that you have a complete set of traces for your issue reproduction call, you need send them to your
TAC engineer.
When you downloaded the traces, you specified a new download file directory. This directory now contains
all of the log and trace files, as well as the TraceCollectionResult*.xml files. TAC requires you to send all
of the contents of the download file directory, not just one or two files.
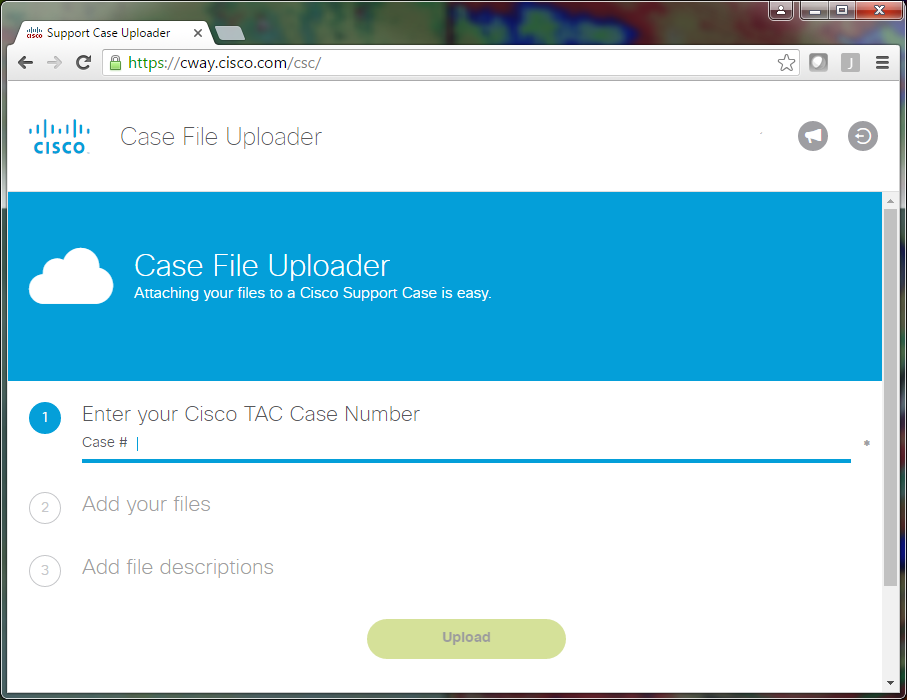
In order to make this simple, upload a single .zip file with the Case File Uploader tool:
Compress the entire download file directory to a single .zip archive file.
1.
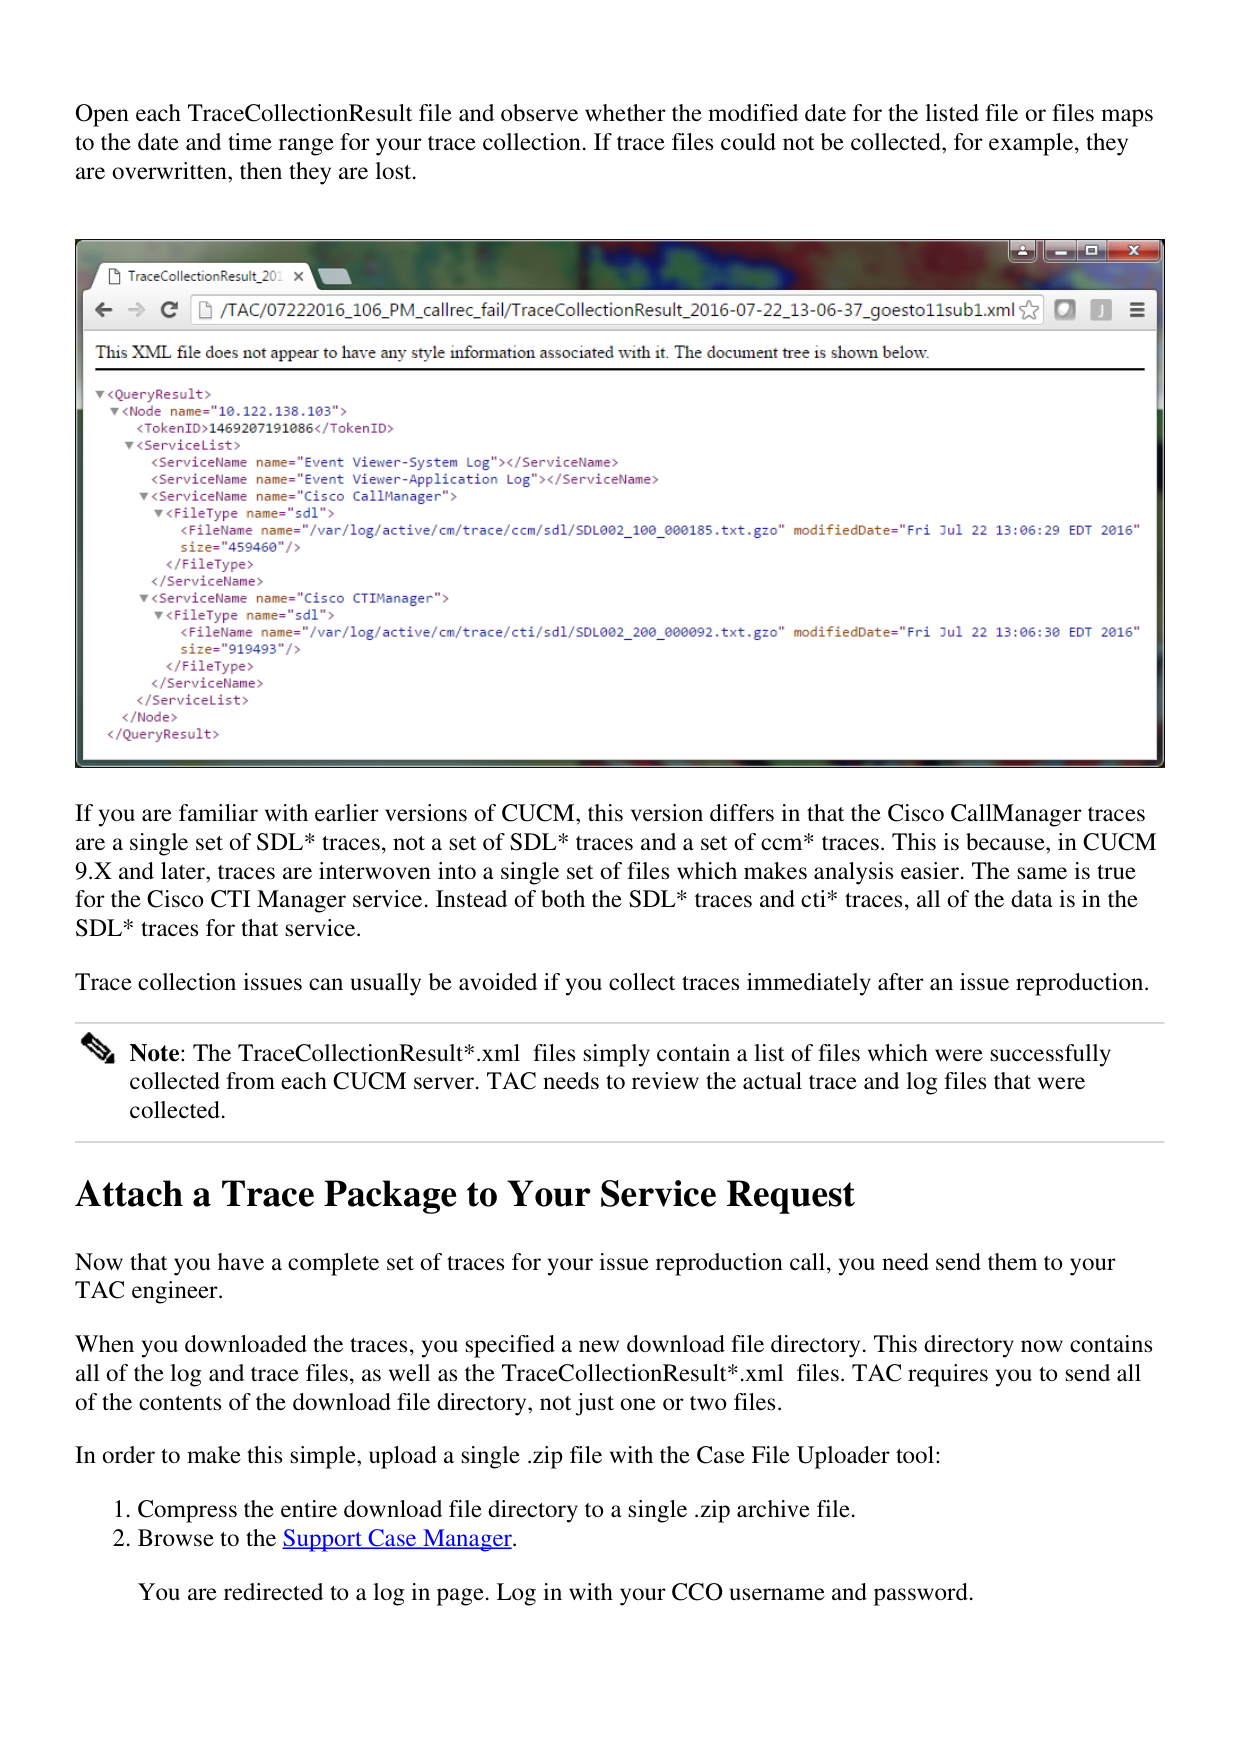
Browse to the Support Case Manager.
You are redirected to a log in page. Log in with your CCO username and password.
2.
Page 16
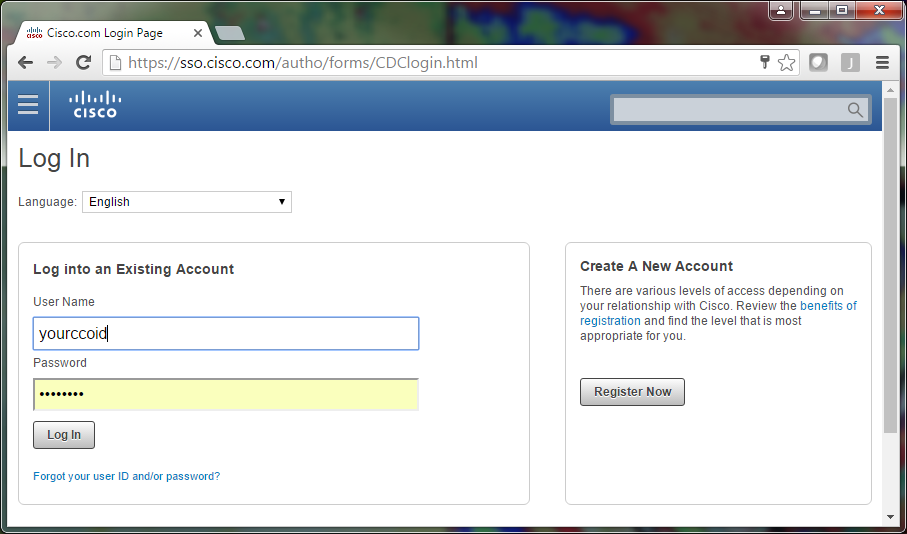
This brings you to the Case File Uploader tool.
Page 17
Enter your service request number.
3.
Add your .zip file.
4.
Add a file description for your TAC engineer. This is a good opportunity to communicate your issue
reproduction notes.
5.
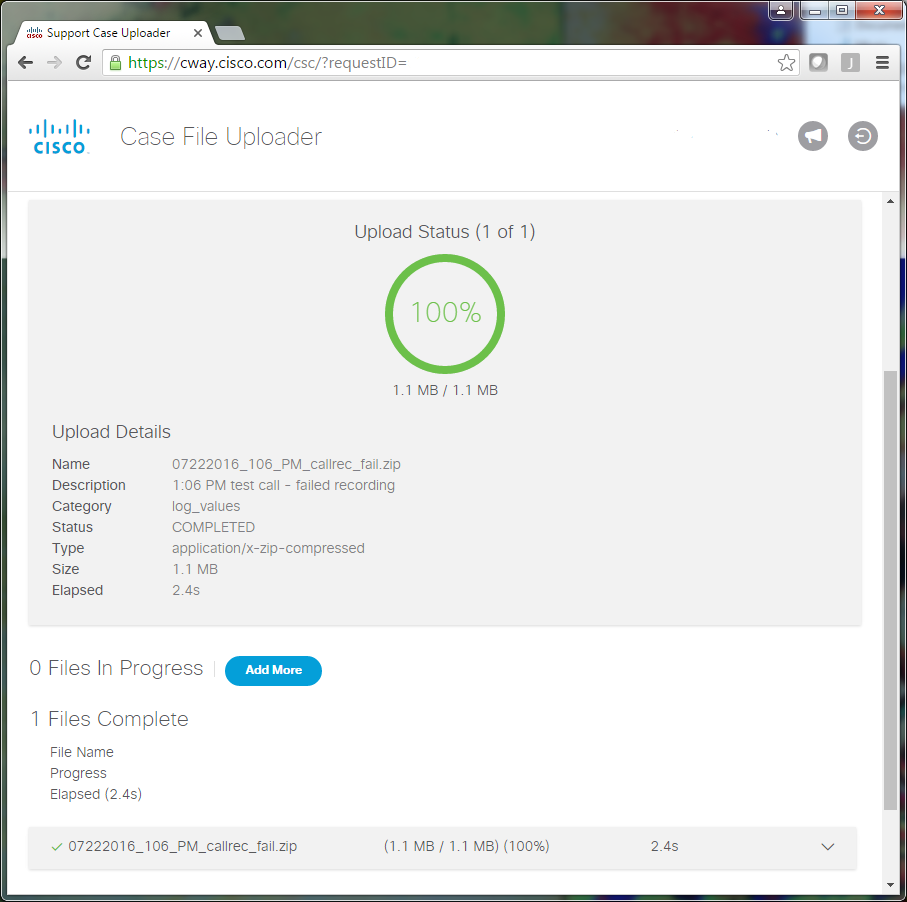
Click Upload. The Case File Uploader tool displays the upload status. Wait for the upload to
complete.
6.
Close the browser window.
7.
Ensure that you have communicated to your TAC engineer all of your issue reproduction notes
whether this was through the upload tool, via email, or verbally. This allows them to start to analyze
the data for you.
8.
Page 18
Analysis
The Cisco CallManager/CTI Manager traces related to the specific call can be analyzed by the Collaboration
Solutions Analyzer tool (ladder diagram/annotations/filtered logs/diagnostic signatures). Check the
documentation on how to use the tool:
Collaboration Solutions Analyzer User Documentation
•
Collaboration Solutions Analyzer
•