Document Metadata
Format: PDF 1.7
Title: Adjust WaterMark in RTMT of Call Manager Procedure
Producer: iText® Core 7.2.5 (AGPL version), pdfHTML 4.0.5 (AGPL version) ©2000-2023 iText Group NV
Creation Date: D:20250805134620-05'00'
Mod Date: D:20250805120025-07'00'
Page 1
Adjust WaterMark in RTMT of Call Manager
Procedure
Contents
Introduction
Prerequisites
Requirements
Components Used
Background Information
LogPartitionHighWaterMarkExceeded
LogPartitionLowWaterMarkExceeded
Procedure
Adjust Low WaterMark
Adjust High WaterMark
Verify
Troubleshoot
Introduction
This document describes the procedure to create additional disk space in logging partition of Cisco Call
Manager with High and Low WaterMark settings.
Prerequisites
Requirements
There are no specific requirements for this document.
Components Used
The information in this document is based on these software and hardware versions:
Cisco Call Manager version 10.0.1-10000-24
•
Cisco Real-Time Monitoring Tool (RTMT) version 10.0(001)
•
The information in this document was created from the devices in a specific lab environment. All of the
devices used in this document started with a cleared (default) configuration. If your network is live, ensure
that you understand the potential impact of any command.
Background Information
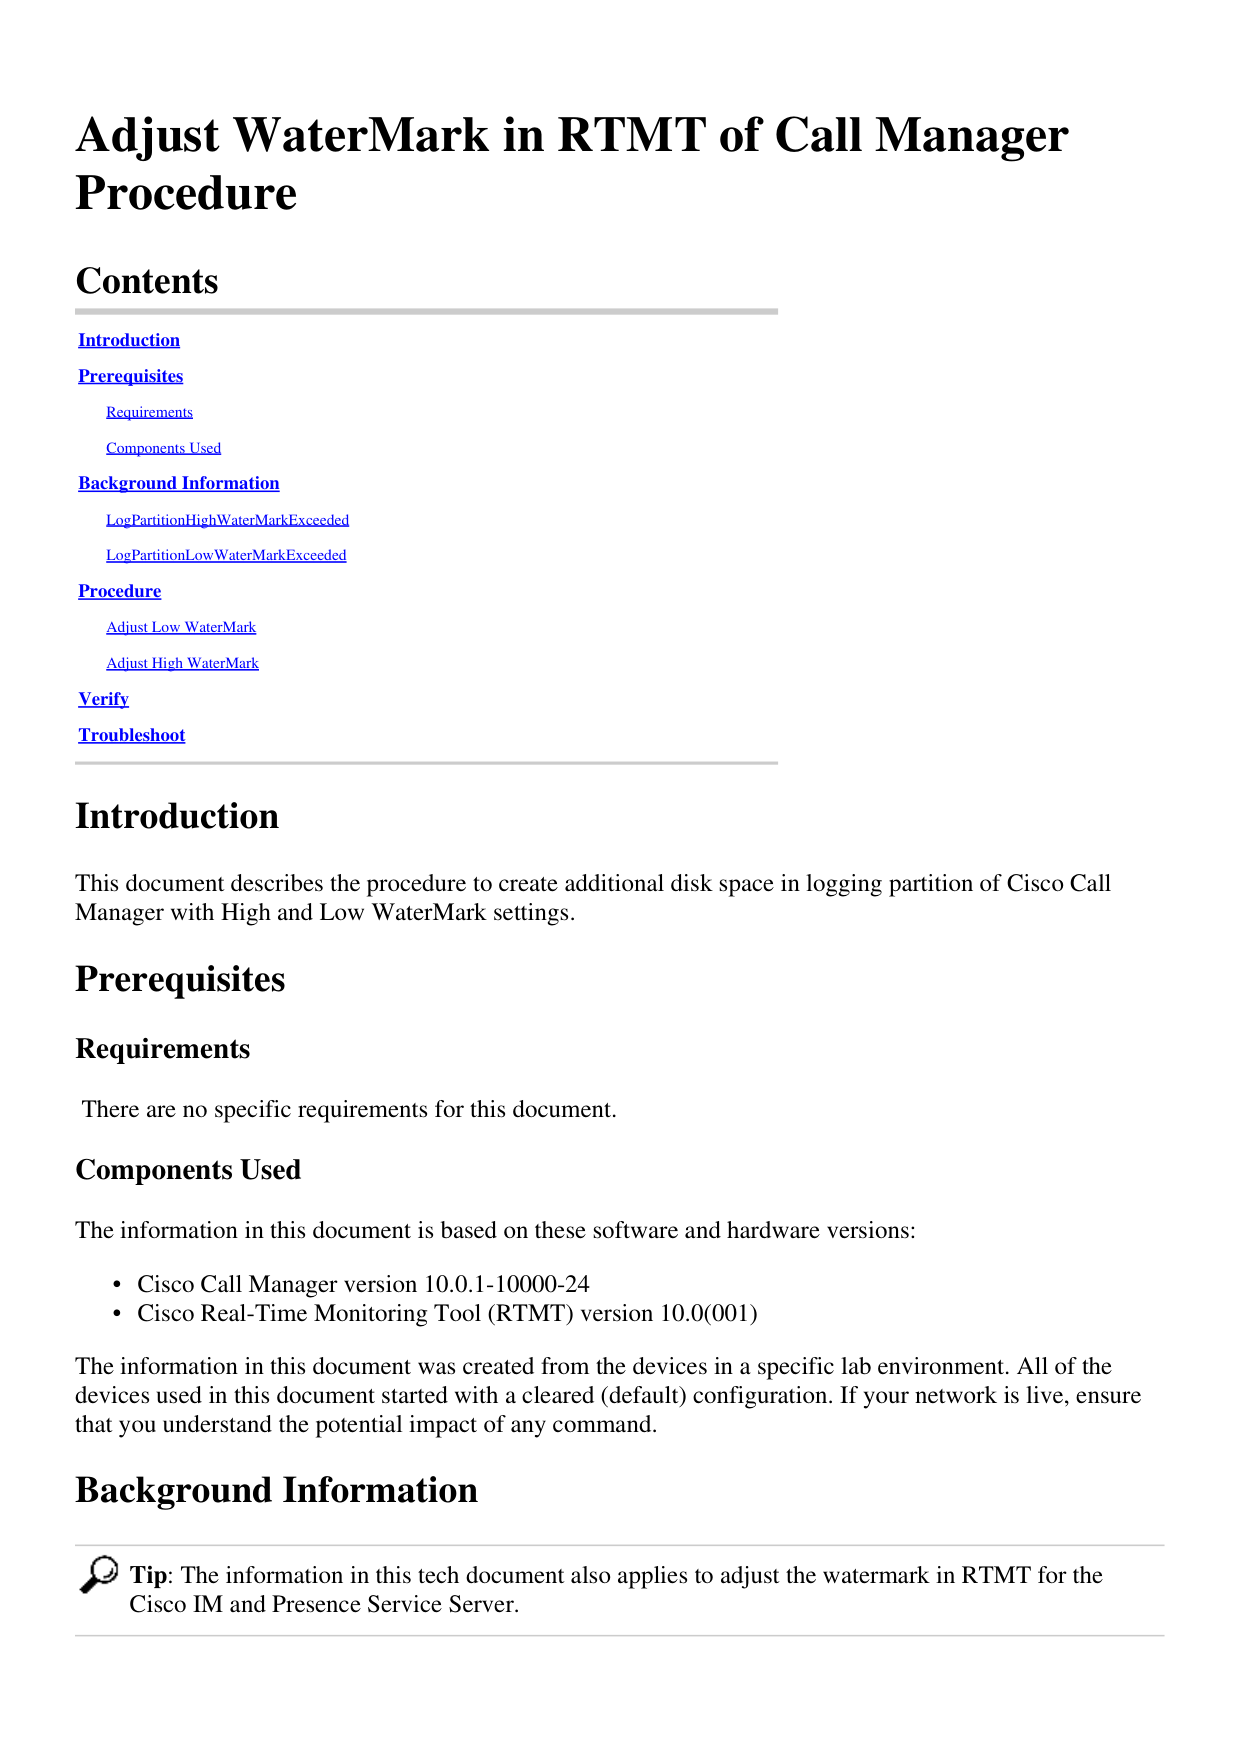
Tip: The information in this tech document also applies to adjust the watermark in RTMT for the
Cisco IM and Presence Service Server.
Page 2
Low WaterMark is a percentage value of the total logging disk space post which when you receive an alert,
indicates the disk space is full by the configured percentage of Low WaterMark.
High WaterMark is a percentage value of the total logging disk space post which the older log files are
purged.
High WaterMark Exceeded and Low WaterMark Exceeded are events that indicate the percentage of used
disk space in the logging partition.
LogPartitionHighWaterMarkExceeded
This event indicates that the percentage of used disk space in the log partition has exceeded the configured
High Watermark.
LogPartitionLowWaterMarkExceeded
This event indicates that the percentage of used disk space in the log partition has exceeded the configured
Low WaterMark.
The threshold percentage value of both events could be configured in RTMT based on the requirement. By
default, High WaterMark is set to 95% of the total logging partition and Low WaterMark is set to 90% of
the total logging partition.
At times, a need arises for certain activities in the call manager to take place when there is insufficient space
in the Logging Partition and additional space needs to be created. During such events, additional space could
be created in the Logging Partition by adjusting the threshold values of High WaterMark and
LowWaterMark, respectively.
When the threshold value of High WaterMark is lowered, it purges older log files, thereby creating
additional disk space in the logging partition.
Procedure
Adjust Low WaterMark
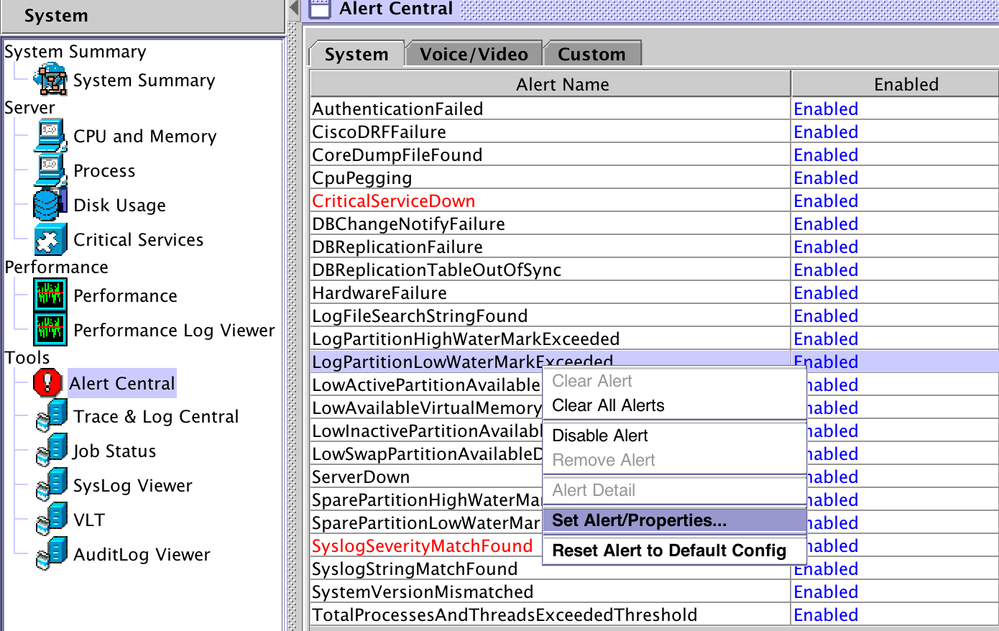
Launch RTMT, and log in to the desired cluster. On the left pane, navigate to System > Tool > Alert
Central.
On the right pane, under System Right, click LogPartitionLowWaterMarkExceeded > Set
Alert/Properties.
Page 3
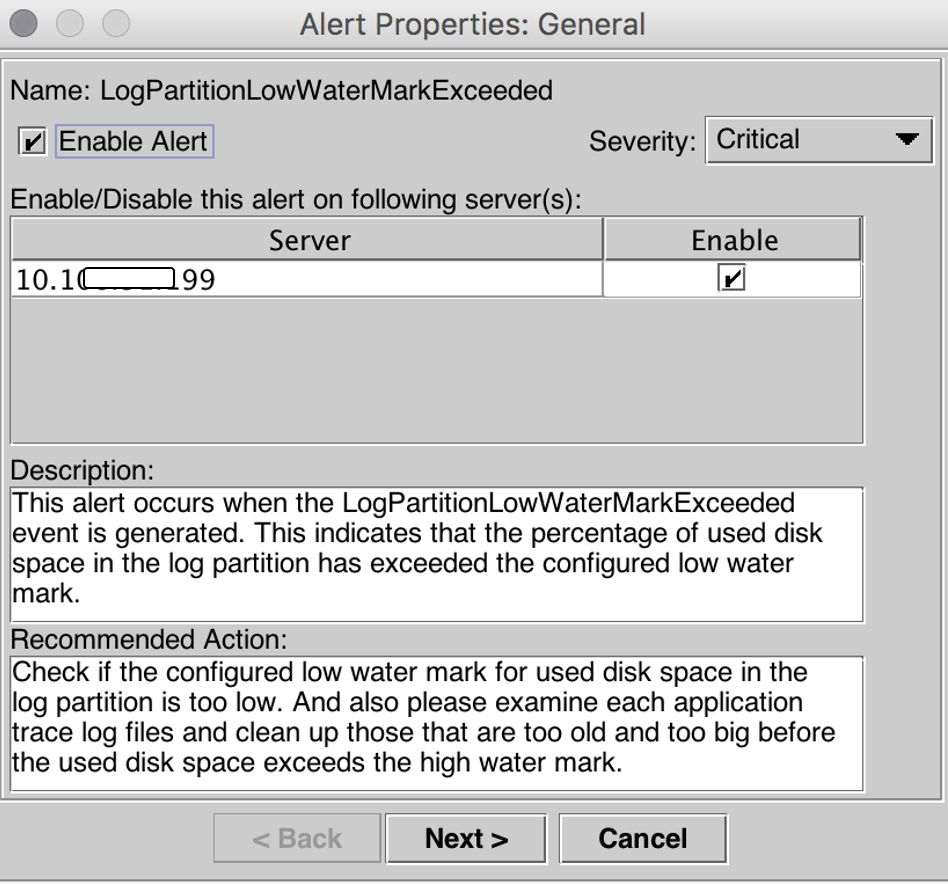
Click Next.
Page 4
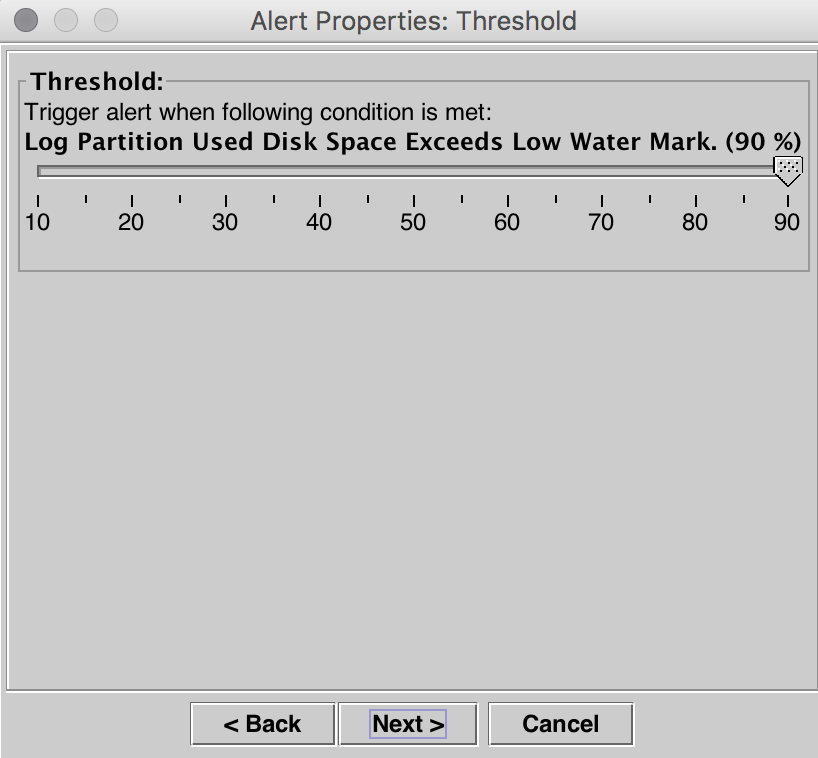
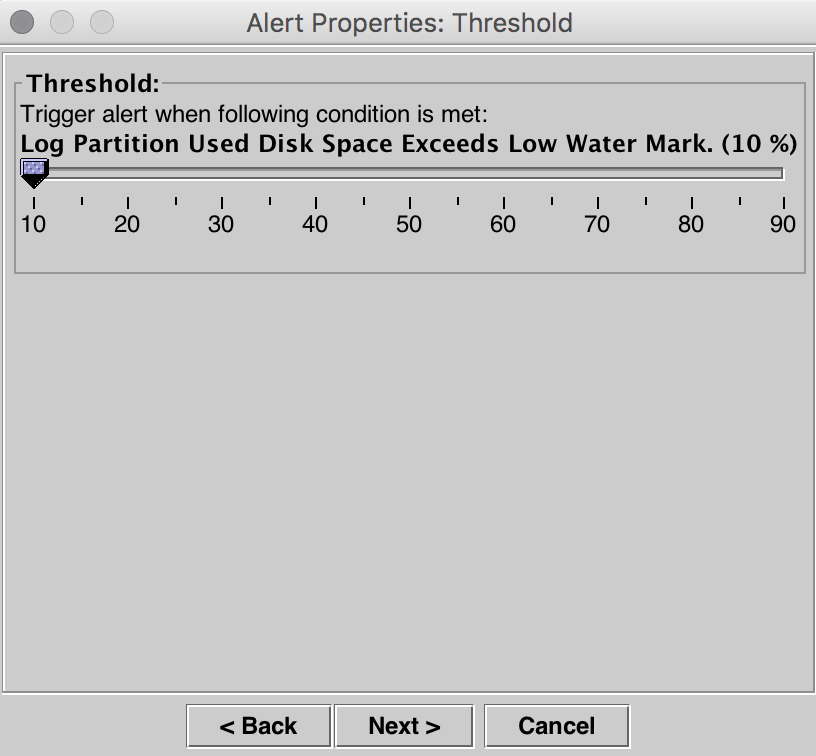
By default, Low WaterMark is set to 90%.
Page 5
Set the Low WaterMark to a lower value, based on your requirement, and then click Next.
Page 6
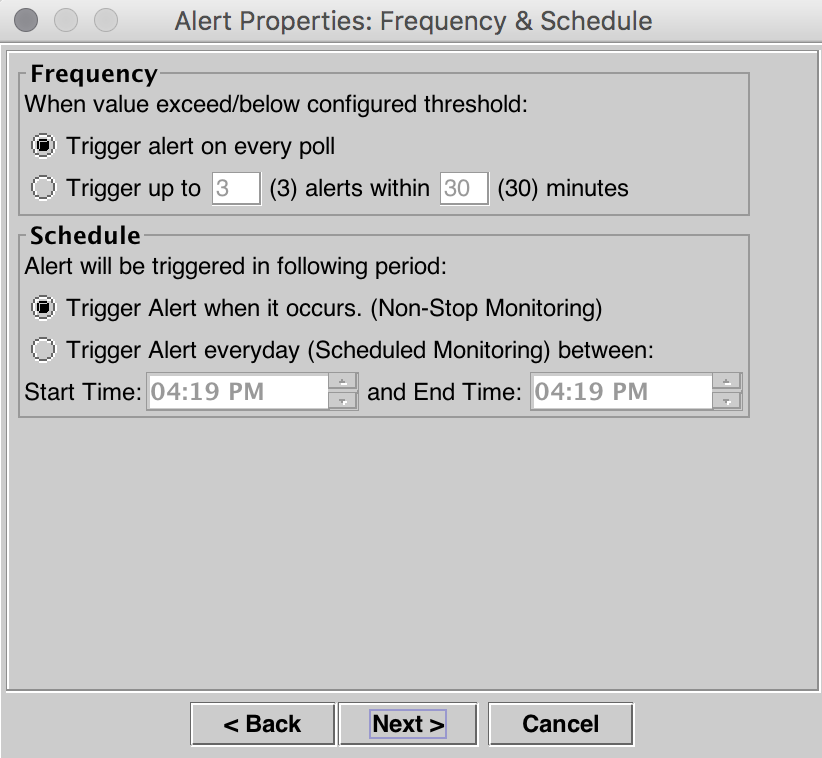
Click Next.
Page 7
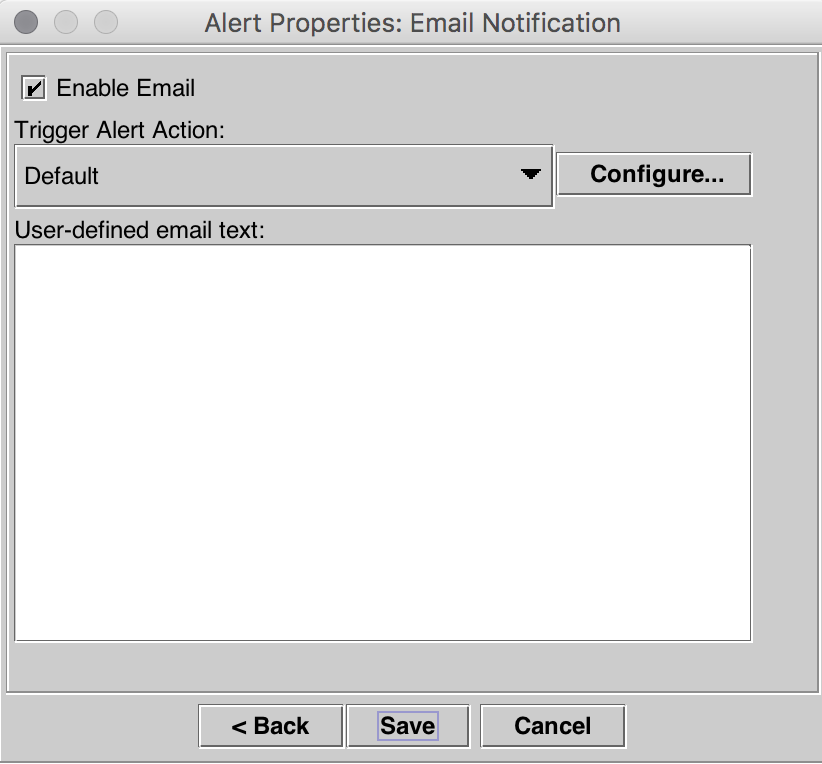
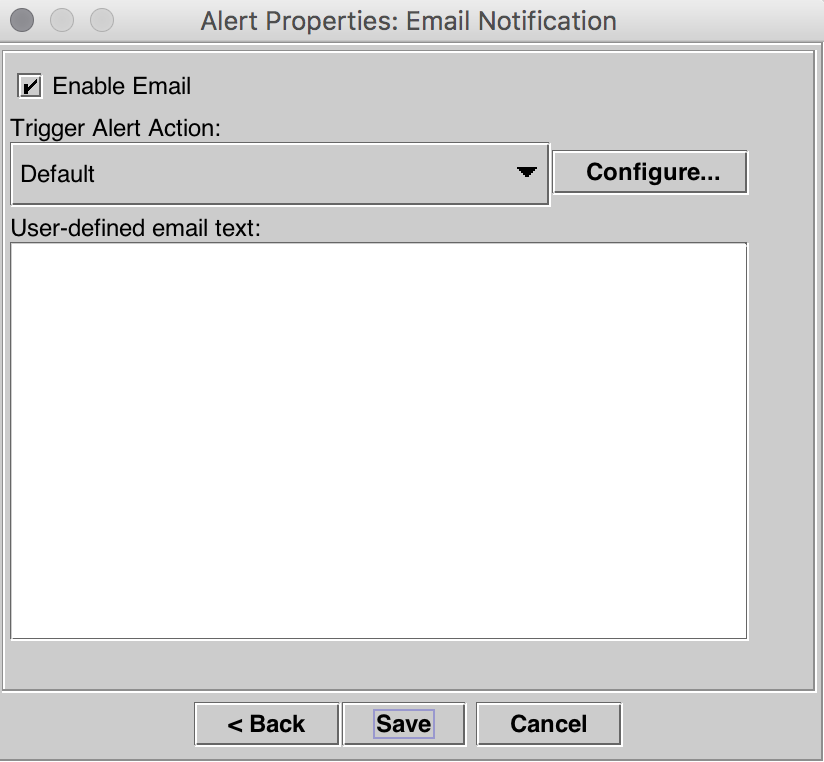
Click Save.
Page 8
Adjust High WaterMark
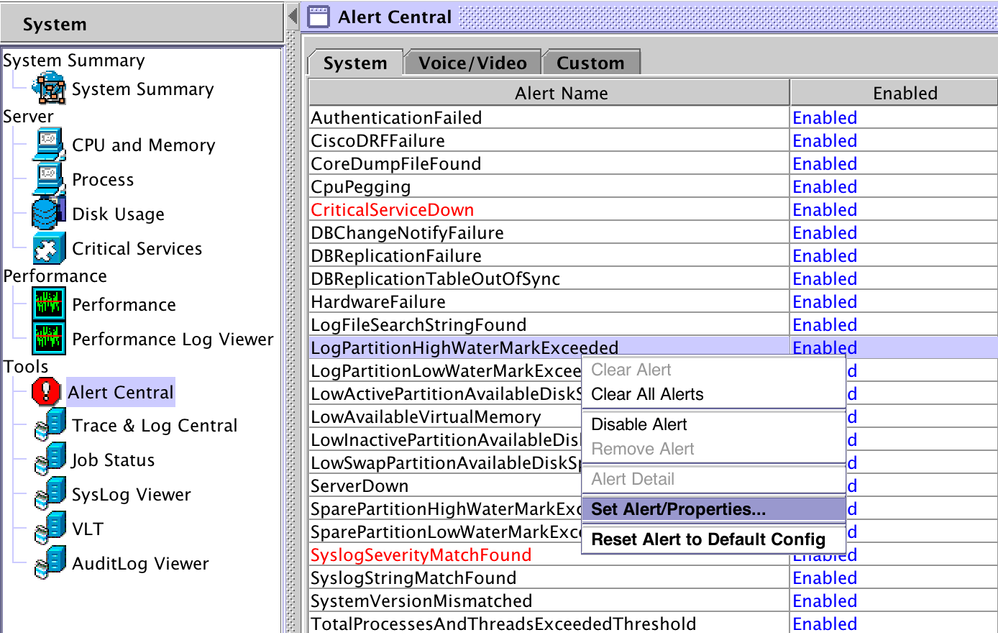
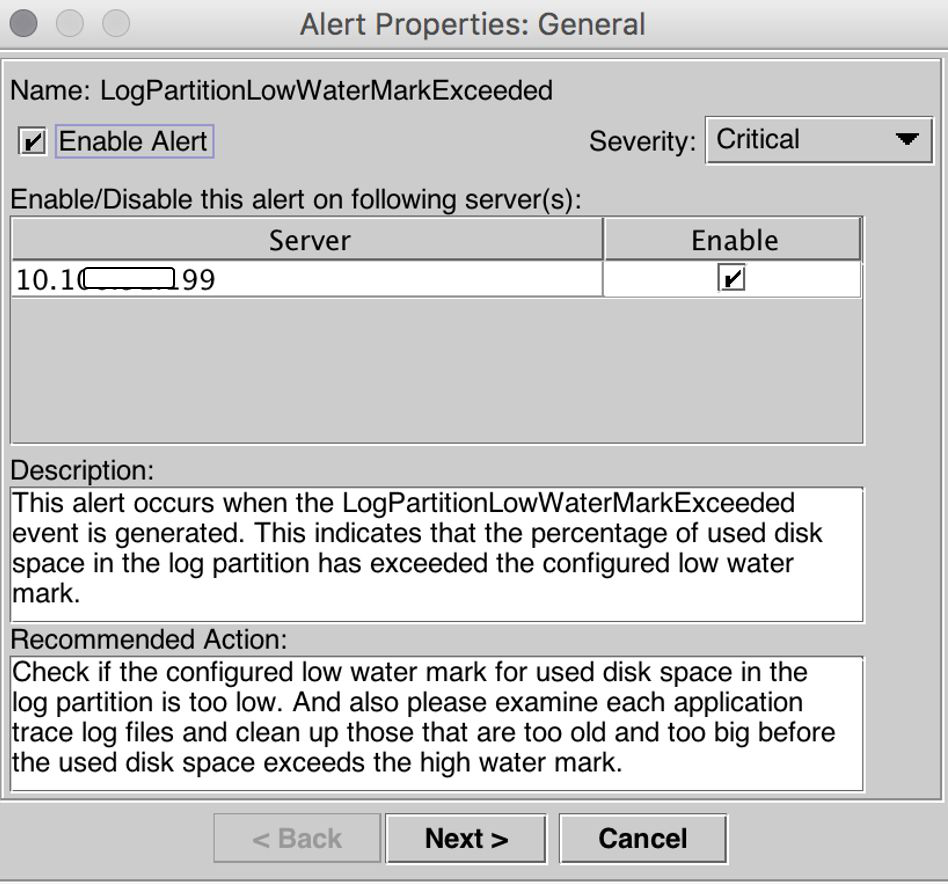
When on the right pane, under System Right, click LogPartitionHighWaterMarkExceeded > Set
Alert/Properties.
Page 9
Click Next.
Page 10
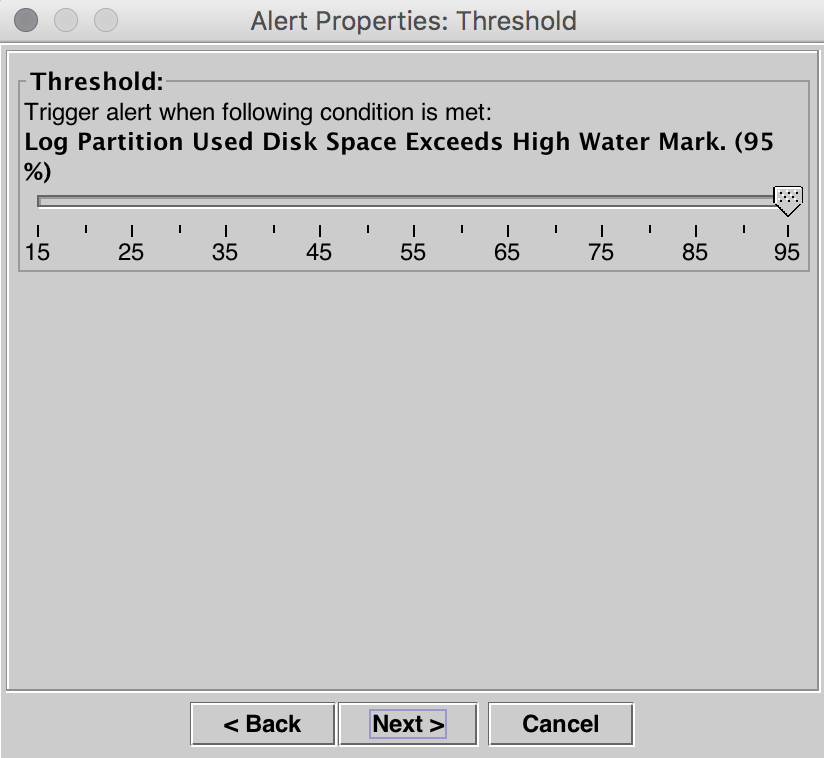
By default, High WaterMark is set to 95%.
Page 11
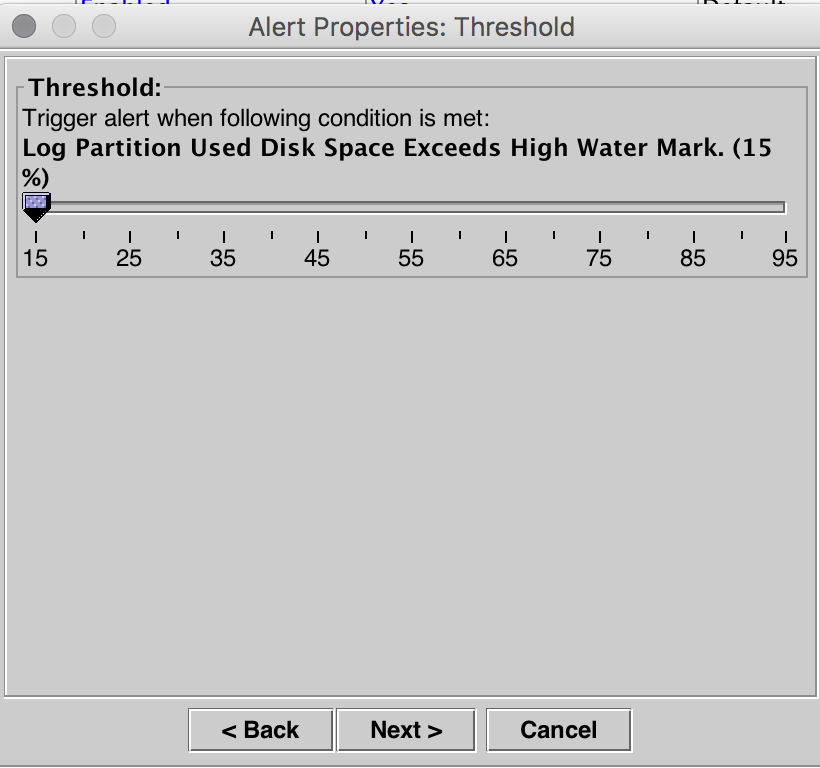
Set the High WaterMark to a lower value, based on your requirement, and then click Next.
Page 12
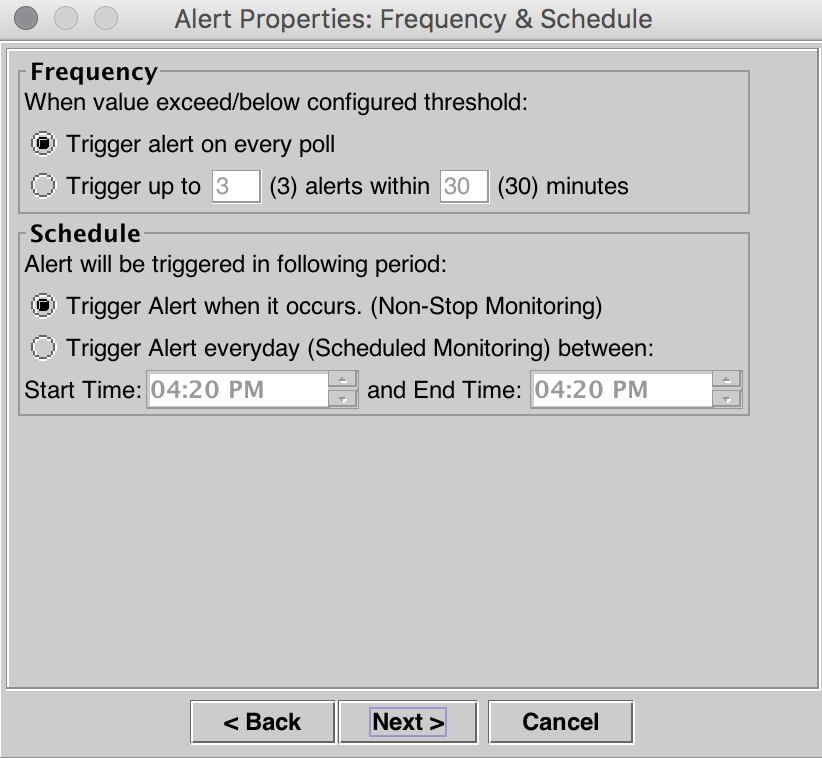
Click Next.
Page 13
Click Save.
Page 14
Verify
The additional disk space is created in the logging partition. After you adjust the High and Low
WaterMarks, it can be verified through the Show Status command on the CLI on the Call Manager.
Before the WaterMark was adjusted.
<#root>
admin:show status
Host Name : publisher
Date : Thu Jul 21, 2016 16:07:16
Time Zone : India Standard Time (Asia/Kolkata)
Locale : en_US.UTF-8
Product Ver : 10.0.1.10000-24
Unified OS Version : 10.0.0.0-2
Page 15
Uptime:
16:07:17 up 72 days, 21:01, 1 user, load average: 0.21, 0.16, 0.11
CPU Idle: 93.06% System: 02.40% User: 04.29%
IOWAIT: 00.25% IRQ: 00.00% Soft: 00.00%
Memory Total: 8062096K
Free: 133808K
Used: 7928288K
Cached: 3312040K
Shared: 0K
Buffers: 342228K
Total Free Used
Disk/active 22187548K 9256672K 12705464K (58%)
Disk/inactive 22187548K 20884420K 176064K (1%)
Disk/logging 77201424K 47443520K 25836240K (36%)
After the WaterMark was adjusted.
<#root>
admin:show status
Host Name : publisher
Date : Thu Jul 21, 2016 16:35:48
Time Zone : India Standard Time (Asia/Kolkata)
Locale : en_US.UTF-8
Product Ver : 10.0.1.10000-24
Unified OS Version : 10.0.0.0-2
Uptime:
16:35:49 up 72 days, 21:29, 1 user, load average: 0.09, 0.12, 0.16
CPU Idle: 98.61% System: 00.88% User: 00.51%
IOWAIT: 00.00% IRQ: 00.00% Soft: 00.00%
Memory Total: 8062096K
Free: 1957460K
Used: 6104636K
Cached: 1477332K
Shared: 0K
Buffers: 360100K
Total Free Used
Disk/active 22187548K 9256660K 12705476K (58%)
Disk/inactive 22187548K 20884420K 176064K (1%)
Disk/logging 77201424K 54805132K 18474628K (26%)
As seen in the Show Status output, the percentage value of the Used Disk/Logging partition has changed
from 36% to 26%.
Troubleshoot
Page 16
There is currently no specific information available to troubleshoot this configuration.