McDewey
/mcpPage 174
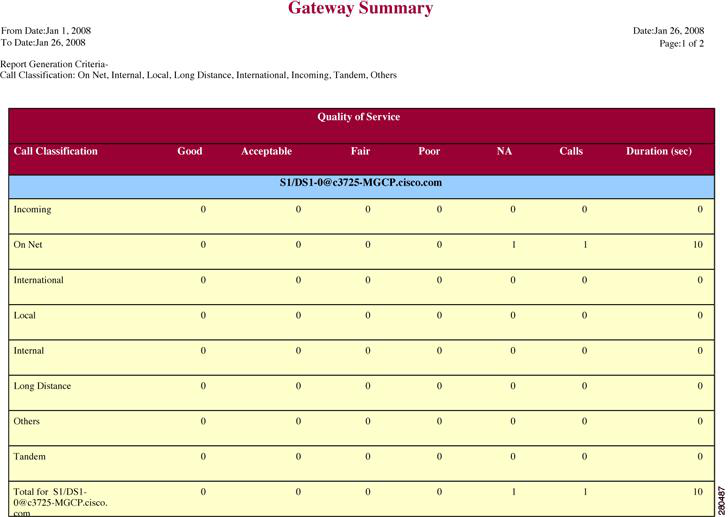
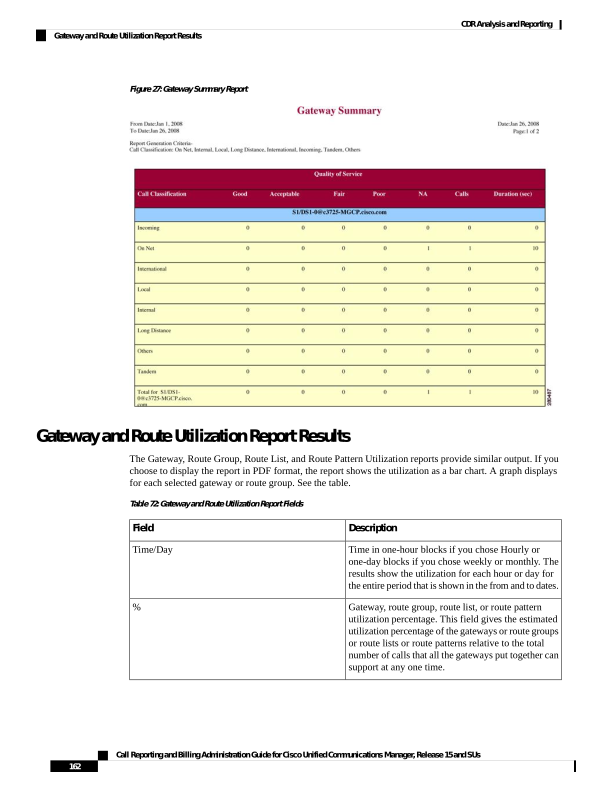
↗ View in doc contextFigure 27: Gateway Summary Report Gateway and Route Utilization Report Results The Gateway, Route Group, Route List, and Route Pattern Utilization reports provide similar output. If you choose to display the report in PDF format, the report shows the utilization as a bar chart. A graph displays for each selected gateway or route group. See the table. Table 72: Gateway and Route Utilization Report Fields Description Field Time in one-hour blocks if you chose Hourly or one-day blocks if you chose weekly or monthly. The results show the utilization for each hour or day for the entire period that is shown in the from and to dates. Time/Day Gateway, route group, route list, or route pattern utilization percentage. This field gives the estimated utilization percentage of the gateways or route groups or route lists or route patterns relative to the total number of calls that all the gateways put together can support at any one time. % Call Reporting and Billing Administration Guide for Cisco Unified Communications Manager, Release 15 and SUs 162 CDR Analysis and Reporting Gateway and Route Utilization Report Results