McDewey
/mcpPage 134
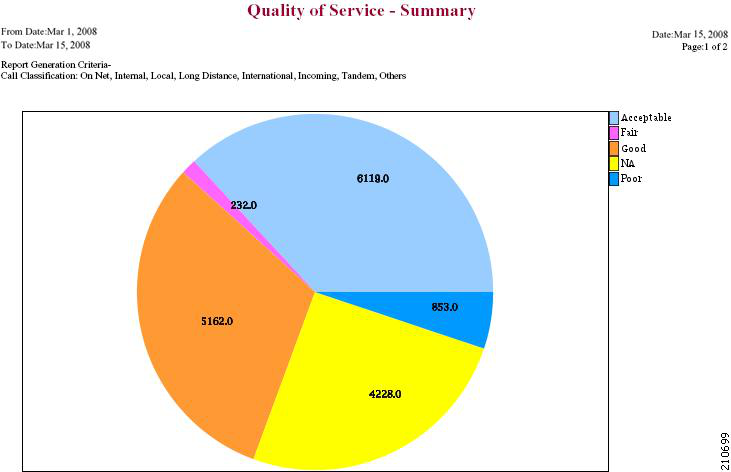
↗ View in doc contextFigure 15: QoS Summary Report in PDF Format QoS by Gateways Report Results The QoS by Gateways report provides the following information. See the table. Table 49: QoS by Gateways Report Fields Description Field Indicates the cumulative hours of the day(s), the days of the week, or the days of the month for the selected date range. Time/Day Displays the percentage of calls for each gateway for the hours of the day, the days of the week, or the days of the month for the selected date range. % of Call Legs Figure 16: QoS by Gateways Report, on page 123 displays sample output of the QoS by Gateways report in PDF format. Call Reporting and Billing Administration Guide for Cisco Unified Communications Manager, Release 15 and SUs 122 CDR Analysis and Reporting QoS by Gateways Report Results